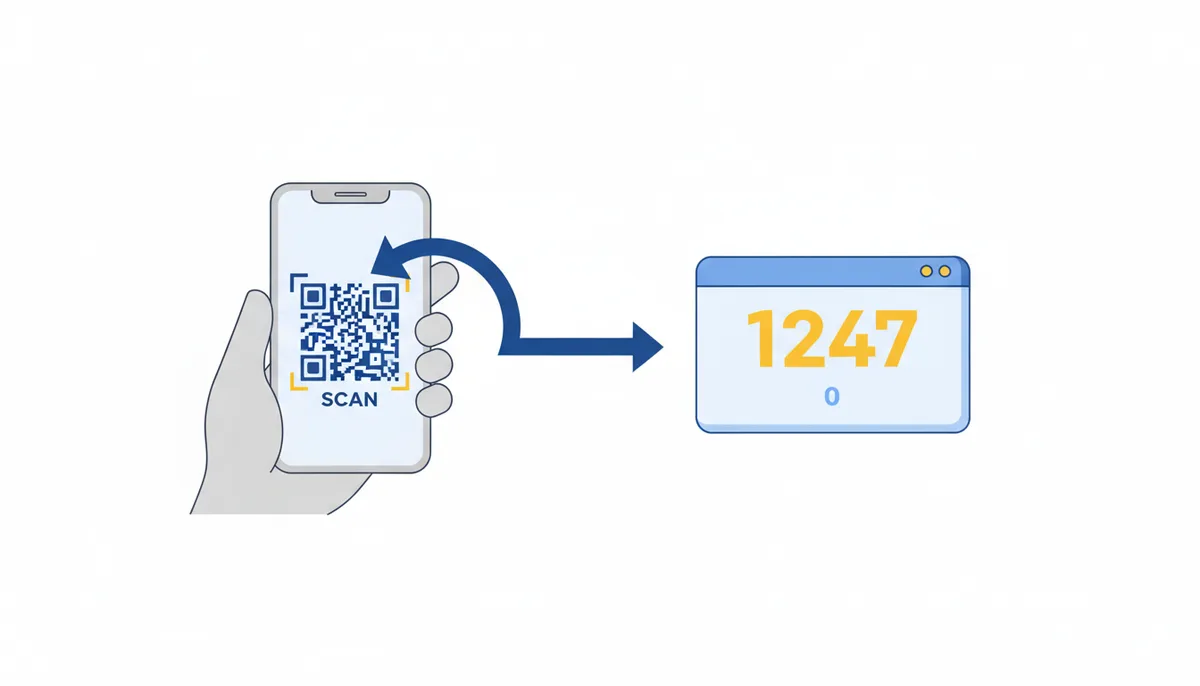
You printed 5,000 flyers with a QR code for a weekend promotion. Monday morning the dashboard shows 1,247 total scans. You feel good until you check sales. Nothing moved. That gap between scans and outcomes is where most marketers get stuck. Scan data tells you someone looked, not what they did next. The rest of this article is about reading that data without pretending it is a conversion.
Why 'Total Scans' Is a Vanity Metric And What to Focus On Instead
The number is big, it updates in real time, and it is easy to screenshot for a Slack channel. Total scans feels like proof of work. It is not proof of impact. A scan is a top-of-funnel action. It is the moment a phone camera reads a pattern. It tells you nothing about intent, attention, or completion.
I have seen the same code scanned three times by one person testing their camera in the car park. I have seen a bus shelter code scanned by commuters who have no intention of buying. The dashboard counts both the same way. If you optimize for total scans you will end up with brighter colors, bigger codes, and more curiosity scans, not more customers.
Use total scans as a sanity check for reach, then move on. The metrics that matter are downstream. Unique scans within a window give you reach. Scan-to-landing-page load confirms the redirect worked. Bounce rate and session duration tell you if the destination is relevant. Goal completions, form submissions, or purchases tell you if the campaign worked. You can have 2,000 scans and zero leads, or 200 scans and 40 sign-ups. The second campaign wins.
Set a rule early: a scan starts a journey, it does not finish it. Track the journey.
How Does QR Code Tracking Actually Work
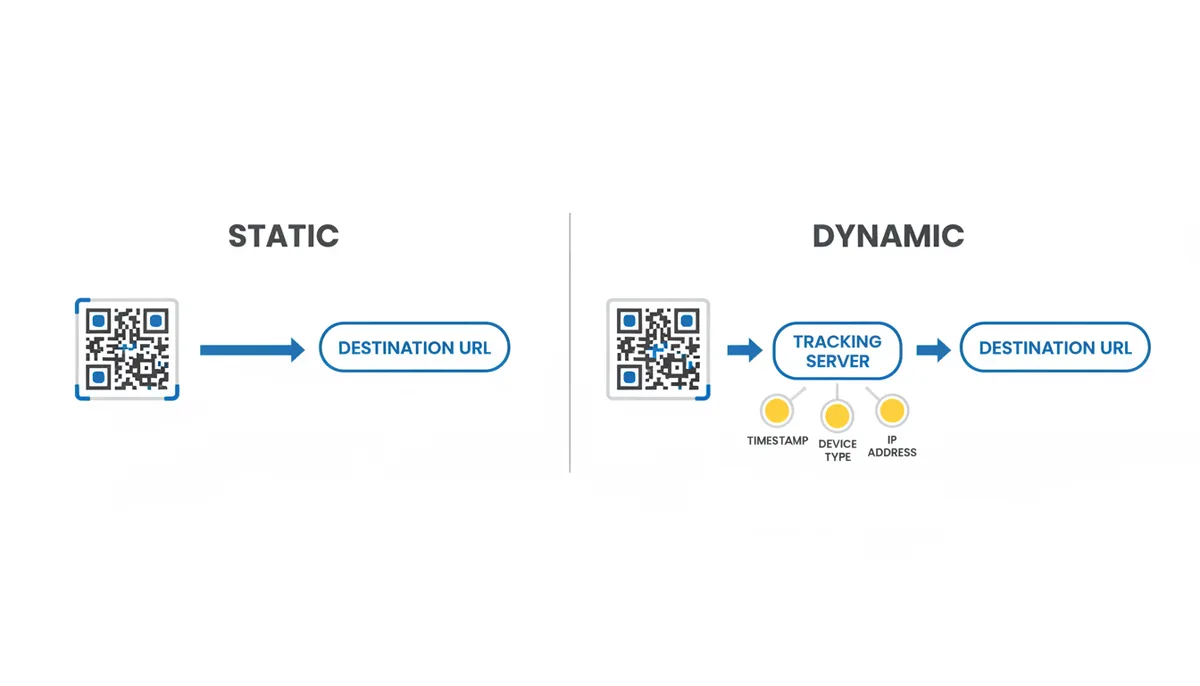
Static QR codes embed the final destination URL directly in the pattern. When a phone reads it, the device opens that URL. No server in the middle can see the read. That is why static codes offer no analytics.
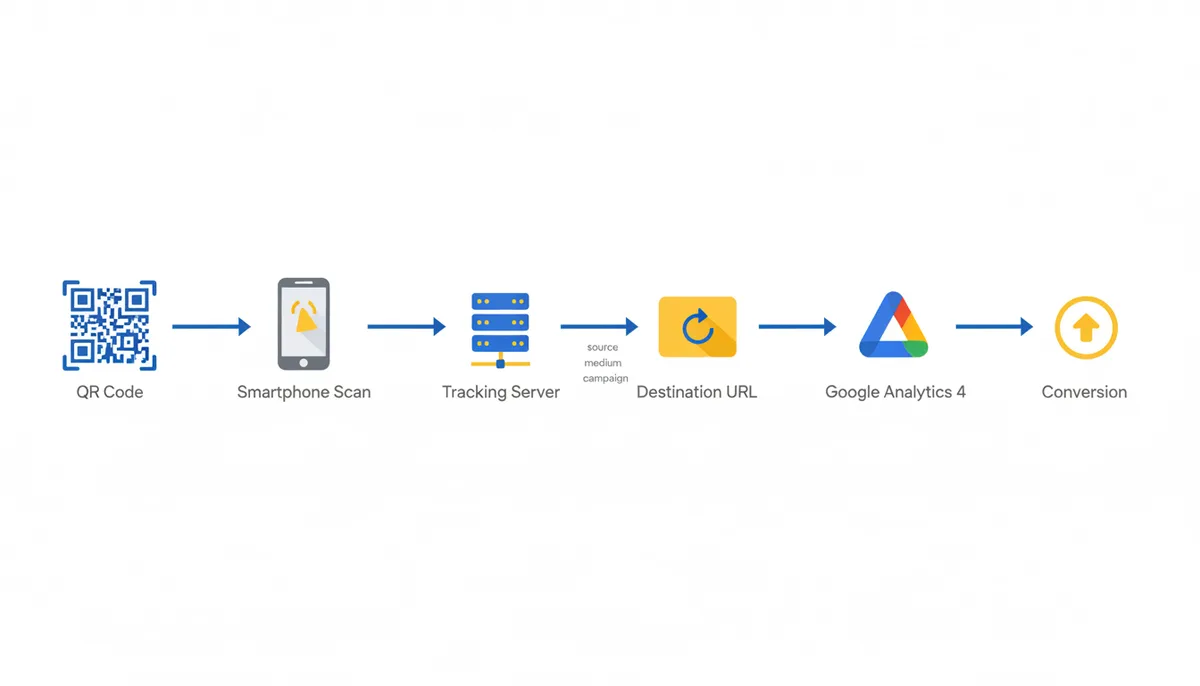
Dynamic QR codes point to a short URL hosted by the generator. The scan hits the tracking server first. The server logs the request, then redirects to the final destination. That redirect is where the data is captured. You get a timestamp for when the scan happened. You get a user agent string that identifies device type, operating system, and browser. You get an IP address that can be mapped to country and city.
You do not get name, email, or phone number from that step. You get a technical fingerprint of the request. The final destination can be a website, a vCard, a WiFi string, or a payment page. The tracking server only knows that a request was made and where it went next.
If you want to know what happened after the redirect, you need web analytics on the destination. The QR platform shows the handoff. Google Analytics 4 shows the behavior after the handoff. Those two data sets only connect if you plan for it.
The Anatomy of a QR Analytics Dashboard Key Metrics Explained
Most platforms show a similar set of metrics. Learn what each one literally measures before you draw conclusions.
Total scans is the raw count of redirect requests. Unique scans is the count of distinct devices within a time window, usually 24 hours. Scans by time or date groups scans by hour or day. Scans by location groups by country and city derived from IP. Scans by device groups by operating system and browser.
Each metric is useful when you know its limits. Scans by time can show if in-store signage performs better at lunch or after work. Scans by location can show if a billboard in one city is driving traffic. Scans by device can flag a mobile experience problem if desktop users convert better.
| Metric | What It Measures | What It Suggests | Common Misinterpretation |
|---|---|---|---|
| Total Scans | Number of times the QR code was scanned, counting repeat scans from the same device | Raw level of engagement with the placement | Assuming each scan equals a new person interested |
| Unique Scans | Number of distinct devices that scanned within a defined window, typically 24 hours | Reach of the campaign | Assuming each unique device equals a unique person |
| Scans by Time/Date | Number of scans grouped by hour or day | When placement is most effective | Assuming spikes are due to campaign quality rather than timing or external events |
| Scans by Location | Number of scans grouped by country and city derived from the client's IP address | Geographic reach of the campaign | Assuming precise street-level location |
| Scans by Device | Number of scans grouped by operating system and browser parsed from the user agent string | Device context for UX optimization | Assuming device type predicts purchase intent |
From Data to Insights How to Interpret Scan Patterns in Context
Data without context is noise. The same spike means different things depending on where the code lived.
A sudden jump in scans on a Tuesday at 10am makes sense if you ran a TV spot that night. A flat line during business hours and a rise after 6pm makes sense for a code on a commuter train poster. A cluster of scans in a single city after a local radio interview is expected. If you do not log where and when the code was placed, you cannot interpret the pattern.
Ask three questions before you act. Where was the code visible during this period? What else happened in that period that could drive scans? What did scanners do after they arrived?
Example. A restaurant placed a dynamic QR code on table tents for a QR menu. Scans by time showed a clear peak between 12:30 and 13:30 and 18:00 to 20:00. That matched service times. Scans by device showed 78 percent iOS. The site was built mobile first, so that was fine. The insight was not the peak, it was the drop off on weekends. Staff interviews revealed the table tents were removed on busy Saturdays. The fix was a sticker on the table, not a new offer.
Context turns a number into a decision.
Connecting Scans to Business Goals with UTM Parameters
QR analytics platforms show what happens before the click. Web analytics shows what happens after. You need both to measure business impact.
Use UTM parameters on the destination URL inside the dynamic QR code. That tags the traffic so Google Analytics 4 can attribute sessions and conversions to the specific QR campaign.
Build the URL like this. Start with the destination. Add ?utm_source=qr, utm_medium=flyer, utm_campaign=summer_flyer_july. If you run multiple placements, change utm_campaign to match each placement. If you test two CTAs, change utm_content.
Steps you can follow. Create the dynamic QR code in your generator. Paste the full URL with UTM parameters as the destination. Test the code with your own phone and confirm the landing page loads and GA4 records a session with the correct source medium and campaign. Publish the code. After launch, open GA4, go to Reports, Acquisition, Traffic acquisition, and filter by Session source medium equals qr flyer. Check sessions, engagement rate, conversions, and revenue.
Now you can compare scan count from the QR dashboard with conversions in GA4. A high scan count with low conversions points to a landing page or offer problem. A low scan count with high conversion rate points to a placement or visibility problem.
7 Common Traps How Marketers Misread Their QR Code Data
Correlation is not causation. Scans spiked when it rained. That does not mean rain causes scans. It means people were indoors and saw the code.
Trap one, treating every scan as a conversion. A scan is attention, not action.
Trap two, ignoring bounce rate. If 60 percent of scanners leave the landing page in under 5 seconds, the code works but the page does not.
Trap three, not segmenting by campaign. One dashboard with multiple codes blends results. You cannot tell which placement works.
Trap four, assuming IP geolocation is exact. IP gives country and often city. It can be off by tens of miles and is unreliable with VPNs and mobile carrier NAT.
Trap five, assuming unique scans equals unique people. One person can have multiple devices. One device can be shared.
Trap six, under-reporting from dark scans. Some scanner apps like Google Lens open the link without passing referrer data. Web analytics may miss those sessions even though the QR dashboard counts the scan.
Trap seven, comparing scan rates across placements without normalizing for impressions. A highway billboard will have lower scan rate than a table tent. That does not make it worse.
How to A/B Test and Optimize Campaigns Using QR Analytics
A/B testing with QR codes is straightforward because each variation gets its own dynamic code.
Pick one variable. Placement, creative, or call to action. Change only that.
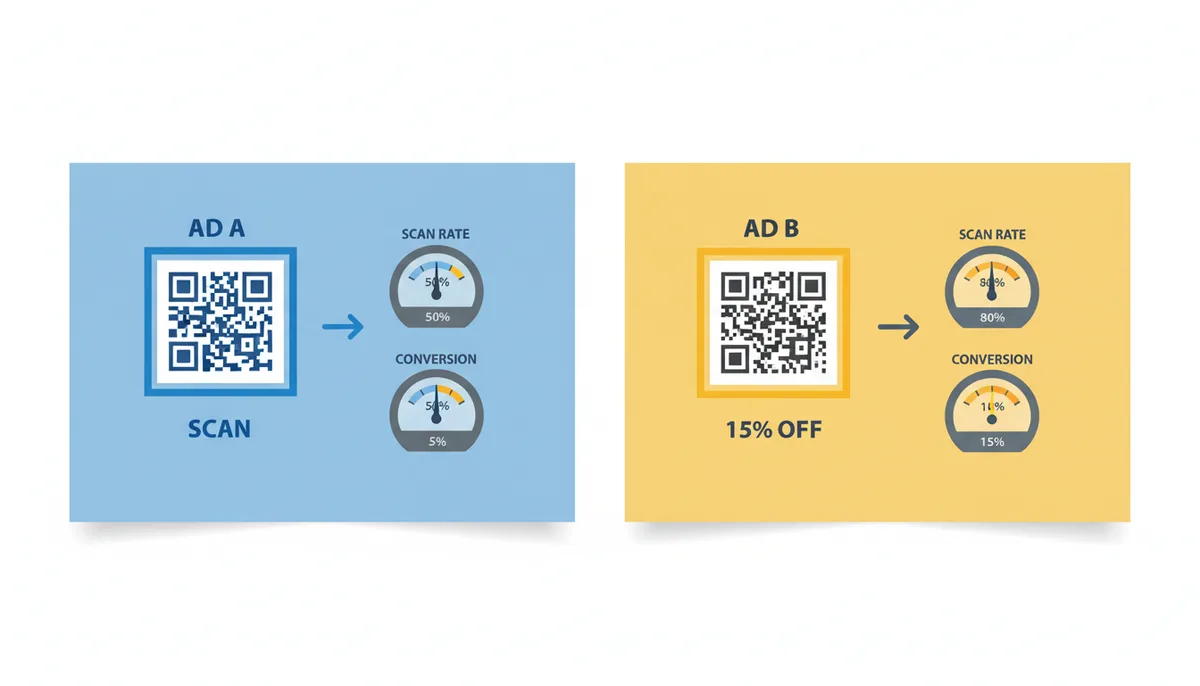
Example. Two identical posters in the same store. Code A uses the CTA Scan for details. Code B uses Scan for 15 percent off. Both point to the same landing page but with different UTM content tags.
Run the test for a fixed period with similar foot traffic. Compare scan counts first. If Code B gets more scans, the offer drives curiosity. Then compare conversion rate in GA4. If Code B gets more scans but the same conversion rate, you gained traffic but not value. If Code B gets more scans and a higher conversion rate, the offer works.
I would choose the winner based on conversion rate, not scan rate. Scan rate tells you what attracts attention. Conversion rate tells you what drives business.
Document the test conditions. Poster height, lighting, time of day, and staff presence all affect results. Without that, you cannot replicate.
Advanced Segmentation Finding Your Most Valuable User Actions
Layering metrics reveals where value comes from.
Ask questions like which city provides the most scans on weekends between 1 and 4pm. Do iOS users from a magazine ad convert at a higher rate than Android users from an in-store display. Do scans from a location more than 50 miles away ever convert.
Segment by time and location together. A code on a university campus may spike at 9am on weekdays. That is students. A code on a hotel key card may spike on Friday evenings. That is travelers.
Segment by device and source. If desktop users convert better, make sure the landing page is optimized for desktop even if most scans come from mobile. QR Code Machine allows dynamic QR codes with analytics tracking so you can monitor these patterns over time.
Use segmented insights to allocate budget. If one city drives 70 percent of conversions, increase media there. If one placement drives scans but no conversions, redesign the landing experience for that audience.
Choosing Your Toolkit Essential vs Advanced Analytics Features
A professional setup needs baseline features. Unique scan tracking, date filtering, location data at country and city level, device breakdown, and CSV export for custom analysis. Without export you are locked into the dashboard view.
Advanced features matter for teams. API access lets you pull scan data into a data warehouse. Team collaboration tools let multiple people manage codes without sharing passwords. Data retention policies matter for compliance and trend analysis.
Integration with web analytics is essential. UTM support is not optional. Password protection and expiration dates are useful for limited time offers and prevent long term misuse.
| Feature | Why it matters | Needed for basic campaigns | Needed for advanced teams |
|---|---|---|---|
| Unique scan tracking | Distinguishes reach from raw requests | Yes | Yes |
| Date filtering | Isolates performance by campaign windows | Yes | Yes |
| Location data country city | Shows geographic reach of placement | Yes | Yes |
| CSV export | Enables custom analysis outside dashboard | No | Yes |
| API access | Automates data pulls into warehouse | No | Yes |
| Team collaboration | Allows shared management without password sharing | No | Yes |
The Limits of QR Analytics What Your Data Can't Tell You
QR analytics cannot identify the individual who scanned. You see device and location estimates, not name or email.
IP based geolocation is approximate. It is good for country and usually city. It is not precise enough for street address. VPNs, corporate networks, and mobile carrier routing skew it.
You cannot know intent from a scan. The user may have scanned out of curiosity, by accident, or to test the code. You need downstream behavior to infer intent.
Privacy regulations like GDPR and CCPA apply. You should be transparent about data collection in the user journey and avoid collecting personal data at scan time unless you have consent.
Set realistic expectations. Use QR analytics to measure reach, timing, and device context. Use web analytics to measure engagement and conversion. Use CRM data to measure revenue. No single dashboard tells the whole story.
What the redirect server actually logs and why the numbers never match perfectly
When you use a dynamic QR code, the scan does not go straight to your site. It hits a redirect endpoint first, the server writes a log line, then it sends a 301 or 302 to the final URL. That log line is the source of truth for the QR dashboard, and it is also the reason the numbers never line up exactly with Google Analytics.
The server records a timestamp in UTC, the raw user agent string, the client IP address, and sometimes the accept language header. From the user agent it derives device family, OS, and browser. From the IP it looks up a geolocation database and returns country and city. That is it. There is no session cookie set at scan time, no login, no identifier that follows the user across devices.
Uniqueness is an estimate. Most platforms define a unique scan as a distinct combination of IP, user agent and a time window, often 24 hours. That means the same person on home wifi on their phone in the morning and on mobile data on their laptop in the evening counts as two uniques. One person sharing a tablet with a family counts as one. You are measuring device requests, not people.
Loss can happen before the log is written. CDN caching can cause undercounting only if redirect endpoints are cached or misconfigured; a burst of scans from the same edge node may be collapsed into one request under those conditions. Some mobile browsers and scanner apps prefetch links, which can trigger the redirect without a human ever looking at the page. Bots may crawl short URLs, and you might see scans at 3am from data center IPs. Good platforms filter obvious bots, but some slip through.
Loss also happens after the redirect. iOS Safari and many scanner apps open the destination in an in-app browser with no referrer. Your web analytics sees a direct session, not a QR campaign. If you did not add UTM parameters to the destination, the QR dashboard and GA4 will never reconcile. Even with UTMs, users who scan and then wait ten minutes before opening the notification will be counted as a scan now and a session later, and the attribution window may be missed.
Geolocation is best effort. IP to city mapping is usually correct at country level and often correct at city level, but carrier grade NAT, VPNs and corporate proxies shift it. A scan from a coffee shop wifi shows the shop's ISP location, not the customer's home. Treat location as a directional signal, not a pinpoint.
If you want clean data, you need to control the chain. Use a dedicated short domain for QR codes, not a shared one. Turn off CDN caching for the redirect endpoint if your platform allows it. Keep the redirect as close to the user as possible to avoid latency that kills scans. And always pair QR analytics with web analytics using UTMs. The redirect log tells you the scan happened. Web analytics tells you if anything useful happened after.
A worked example from a retail pop-up that turned scans into revenue
A small apparel brand ran a weekend pop-up in a shopping mall and wanted to know whether people who scanned a QR code actually bought. They printed two versions of a shelf talker. Both pointed to the same product page but with different UTM content tags and different offers. Version A said Scan for details. Version B said Scan for 15 percent off today only.
The team set up two dynamic QR codes, each with its own short URL and UTM parameters for source, medium and campaign. The destination page was identical except for a banner that showed the discount when the UTM content matched version B. They also added a hidden field to the checkout form that captured UTM parameters so the e-commerce platform could attribute sales.
During the weekend staff logged foot traffic estimates by hour and noted when the talkers were restocked or moved. On Monday they pulled the QR dashboard and then GA4. The dashboard showed more scans for version B, which was expected because the offer is more compelling than details. The interesting part was downstream.
In GA4 the sessions tagged with version B had a higher engagement rate and more add to carts. The scan-to-session match was not one to one because some scans were prefetch or duplicate requests, so they compared ratios rather than raw counts. The version B cohort generated more transactions per session than version A, and the average order value was similar. The offer attracted more scans and converted a larger share of those scans.
The team then segmented by time of day. Scans peaked during lunch and after 5pm, which matched mall traffic. They also saw a cluster of scans from a city about an hour away. That prompted a check of the mall's event calendar, which showed a local university had a career fair that weekend. The brand decided to keep the discount QR for high traffic weekends and use the details QR for weekday in-store displays where the offer would dilute margin.
The decision was not based on total scans. It was based on scans paired with sessions, add to carts, and completed purchases, all tied together with UTMs and time context. The pop-up cost was the same either way. The difference was choosing the right CTA for the right moment and knowing it from data, not from a hunch.
Where QR campaigns break in the real world
The analytics can be perfect and the campaign still fails because the code is unreadable in the field. The most common failure is print quality. A QR code printed too small, with insufficient quiet zone, or on glossy material that reflects light will not scan reliably. Phones at arm's length need a module size that is large enough for the camera to resolve. On a poster viewed from three meters, that means a physical size measured in centimeters, not millimeters.
Contrast matters more than color. Black on white is the safe default. Colored codes work only when the foreground and background maintain a high contrast ratio and the logo overlay does not cover the finder patterns. Many generators let you embed a logo. That is fine until the logo covers 15 percent of the code and the error correction is set to low. Error correction levels L, M, Q, H trade data capacity for damage tolerance. If you need a logo, use a higher correction level and test the printed code with multiple phones.
Glare is the silent killer. Glass cases, car windshields, and glossy menus create reflections that break the pattern. Matte finishes, angled placement, and a small matte sticker instead of a printed sheet help. Staff will tell you the code works fine on their phone in the office under LED lights and fails on the shop floor under spotlights.
FAQ
Can you see exactly who scanned your QR code
No. You can see data about the device that scanned it, like its operating system, browser, and estimated location from its IP address, but you cannot identify the individual person.
What's the difference between a scan and a click
A scan is the physical act of using a device to read the QR code. A click is the subsequent action of the user tapping a link or button on the destination landing page. A scan gets them to the page, a click is what they do once they're there.
How accurate is the location data in QR code analytics
It is based on the device's IP address, making it generally accurate at the country and city level. However, it is not precise enough to identify a specific street address and can be skewed by VPNs or cellular network routing.
Do static QR codes provide any analytics
No. Static QR codes contain the final destination URL directly and have no tracking mechanism. To collect analytics, you must use a dynamic QR code, which passes the user through a tracking server.
How do I connect QR code scans to my CRM or sales data
The best method is to use UTM parameters in your QR code's URL. When a user fills out a form on your landing page, capture these UTMs in hidden fields. This allows your CRM to attribute the new lead or sale directly to that specific QR code campaign.
What is a good scan rate for a QR code campaign
There is no universal benchmark. A good scan rate depends entirely on the context, the placement, the industry, the value of the offer, and the clarity of the call to action.
Sources
- ISO/IEC - International Organization for Standardization — The technical specifications for QR Code symbology (ISO/IEC 18004), establishing the foundational standard for how QR codes are generated and read.
- GDPR.eu — Information on the General Data Protection Regulation (GDPR), relevant to the section on data privacy, limitations, and ethical considerations when tracking user data like IP addresses.
- Marketing Science Institute (MSI) — Academic research and principles on marketing measurement and attribution, backing the core concept of moving beyond vanity metrics to measure true business impact.